Looking for classes? Ksquare Career Institute, Bengaluru →

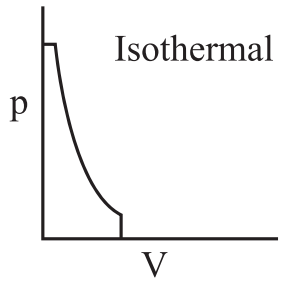
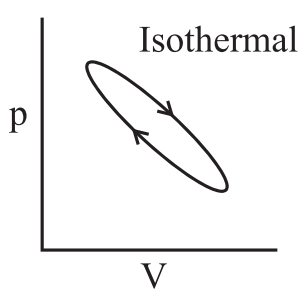
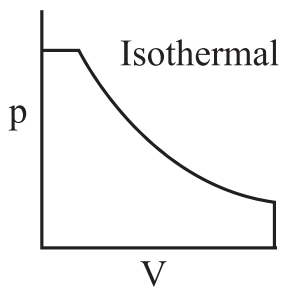
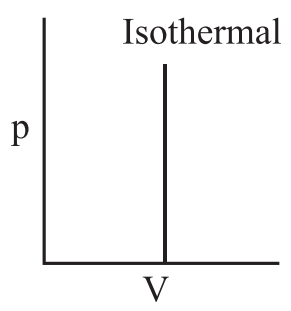
Which of the following p-V curve represents maximum work done?
A
-
B
-
C
-
D
-
Detailed Solution
In a p-V graph, the area under the curve represents the magnitude of work done.
The area is maximum for the isothermal curve extending over the largest volume change (curve (1) in the original paper).