Looking for classes? Ksquare Career Institute, Bengaluru →

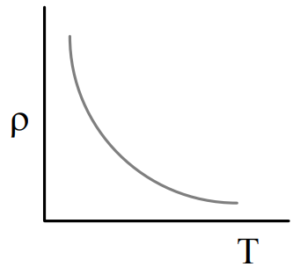
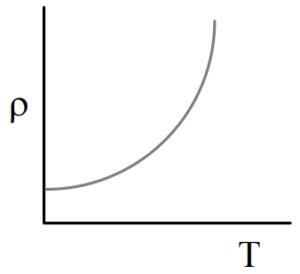
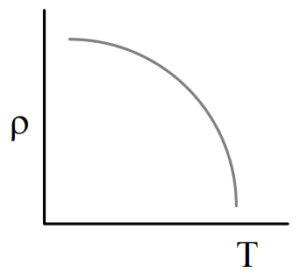
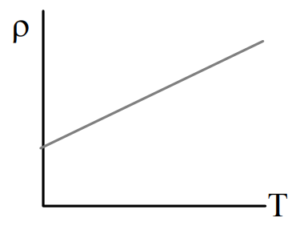
Which of the following graph represents the variation of resistivity ($\rho$) with temperature ($T$) for copper?
A
- 
B
- 
C
- 
D
- 
The answer is B.