Solution

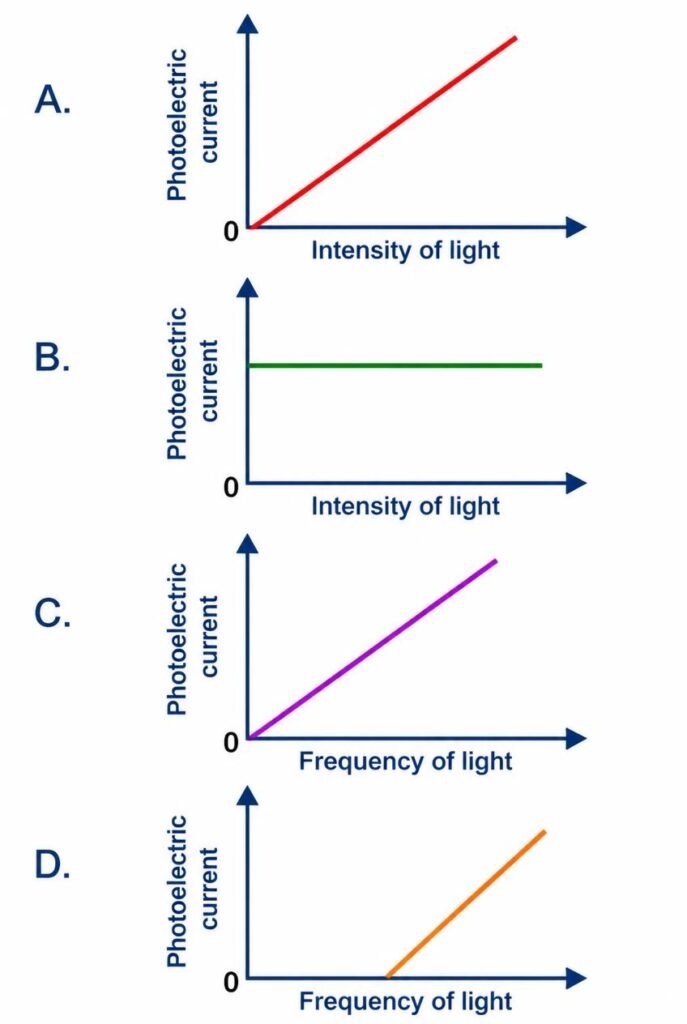
Photoelectric current is directly proportional to the intensity of incident radiation for frequency above threshold, represented by graph A only.

The number of photoelectrons emitted per second (and hence saturation photoelectric current) is directly proportional to the intensity of the incident light (provided $\nu > \nu_0$). Thus, a plot of photoelectric current against intensity is a straight line passing through the origin (Graph A). Photoelectric current does not vary linearly with frequency above threshold (stopping potential does), so C and D are incorrect representations.

Concept Photoelectric Current vs Intensity

Dual Nature of Radiation and Matter in past papers

82 questions from this chapter have appeared across 27 exam years.