Looking for classes? Ksquare Career Institute, Bengaluru →

In an oscillating spring mass system, a spring is connected to a box filled with sand. As the box oscillates, sand leaks slowly out of the box vertically so that the average frequency $\omega(t)$ and average amplitude $A(t)$ of the system change with time $t$. Which one of the following options schematically depicts these changes correctly?
A
Diagram showing constant $\omega(t)$ and decreasing $A(t)$ 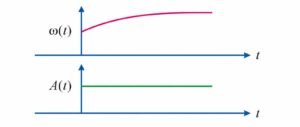
B
Diagram showing $\omega(t)$ increasing with time and $A(t)$ decreasing with time 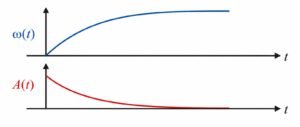
C
Diagram showing $\omega(t)$ decreasing with time and $A(t)$ constant 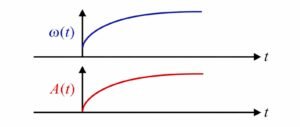
D
Diagram showing both $\omega(t)$ and $A(t)$ increasing with time 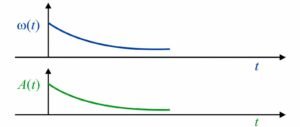
Explanation
Since mass $m(t)$ decreases, $\omega = \sqrt{k/m}$ increases, while lost sand carries away mechanical energy, steadily decreasing amplitude $A(t)$.
Detailed Solution
For a spring-mass system, the angular frequency is $\omega(t) = \sqrt{k/m(t)}$. As sand leaks out, total mass $m(t)$ decreases, which implies that $\omega(t)$ progressively increases. Simultaneously, as sand drops vertically out of the moving box, it carries away kinetic energy without an opposing reaction force, so the total mechanical energy of the remaining oscillator decreases, causing the average amplitude $A(t)$ to steadily decrease. Thus, graph (2) correctly shows $\omega(t)$ rising and $A(t)$ declining.