Looking for classes? Ksquare Career Institute, Bengaluru →

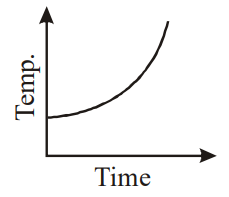
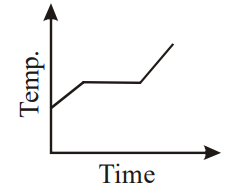
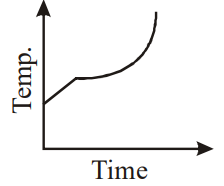
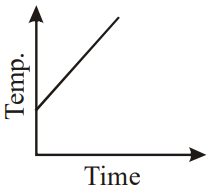
Liquid oxygen at 50 K is heated to 300 K at constant pressure of 1 atm. The rate of heating is constant. Which one of the following graphs represents the variation of temperature with time?
A
- 
B
- 
C
- 
D
- 
Detailed Solution
At first the liquid oxygen warms up, so its temperature rises steadily with time.
At the boiling point (about 90 K at 1 atm) the heat supplied is used as latent heat of vaporisation, so the temperature stays constant until all the liquid has changed to gas.
After that the temperature of the gas rises again up to 300 K.
So the graph rises, has a horizontal portion, and then rises again.
At the boiling point (about 90 K at 1 atm) the heat supplied is used as latent heat of vaporisation, so the temperature stays constant until all the liquid has changed to gas.
After that the temperature of the gas rises again up to 300 K.
So the graph rises, has a horizontal portion, and then rises again.