Looking for classes? Ksquare Career Institute, Bengaluru →

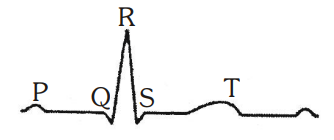
The diagram given here is the standard ECG of a normal person. The P-wave represents the:
A
End of systole
B
Contraction of both the atria
C
Initiation of the ventricular contraction
D
Beginning of the systole
Detailed Solution
The P-wave represents the electrical excitation (depolarisation) of the atria, which leads to the contraction of both atria.