Looking for classes? Ksquare Career Institute, Bengaluru →

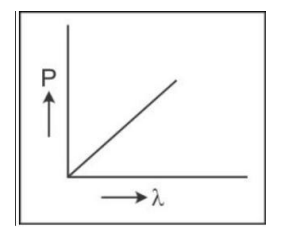
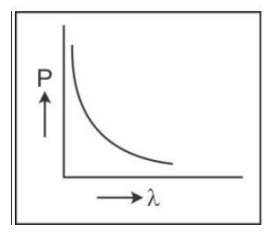
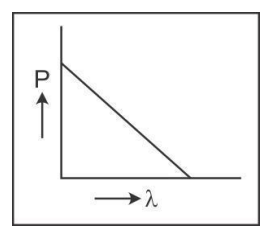
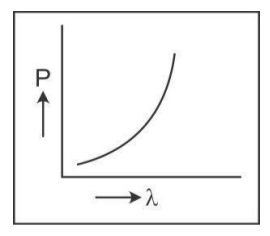
Which of the following figures represent the variation of particle momentum and the associated de-Broglie wavelength?
A
- 
B
- 
C
- 
D
- 
Detailed Solution
$\lambda = \frac{h}{p} \Rightarrow p \propto \frac{1}{\lambda}$
Momentum is inversely proportional to wavelength, so the p–$\lambda$ graph is a rectangular hyperbola: momentum decreases as wavelength increases.
Momentum is inversely proportional to wavelength, so the p–$\lambda$ graph is a rectangular hyperbola: momentum decreases as wavelength increases.