Looking for classes? Ksquare Career Institute, Bengaluru →

Kinetic Theory
Charles's Law (Isobaric T-V Graphs)
1 question from 1 paper, each with its answer.
- question
- 1
- paper
- 1
- years asked, 2017–2026
- 1 of 10
- of Kinetic Theory
- 2.94%
Concepts tested
- Comparing isobars on a T-V graph
All Questions
2024 1 question
-
The following graph represents the T-V curves of an ideal gas (where T is the temperature and V the volume) at three pressures $P_1$, $P_2$ and $P_3$ compared with those of Charles's law represented as dotted lines.
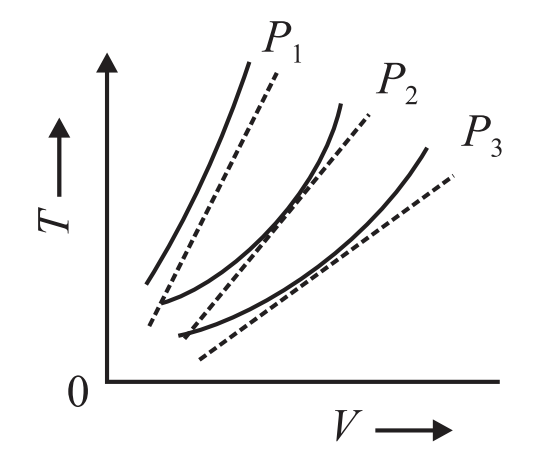 From the ideal gas equation $PV = nRT$: $T = \left(\frac{P}{nR}\right)V$, i.e. $T \propto V$ with slope $\frac{P}{nR}$ So a steeper T-V line corresponds to a higher pressure. From the graph, the $P_1$ curve is steepest and $P_3$ is least steep. So $P_1 > P_2 > P_3$.