Looking for classes? Ksquare Career Institute, Bengaluru →

Motion in a Straight Line
Position-Time Graphs
3 questions from 3 papers, each with its answer.
- questions
- 3
- papers
- 3
- years asked, 2017–2026
- 1 of 10
- of Motion in a Straight Line
- 6.67%
Appears in
Concepts tested
- Position-time graphs
- slope of displacement-time graph
- Slope of distance-time graph
All Questions
2022 1 question
-
The displacement time graphs of two moving particle make angles of $30^\circ$ and $45^\circ$ with the x-axis as shown in the figure. The ratio of their respective velocity is :
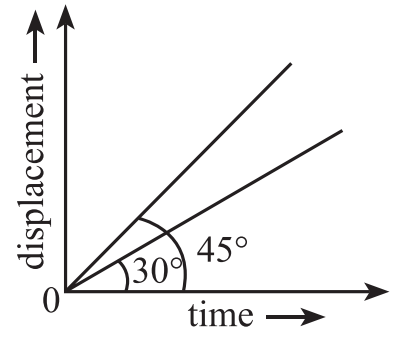 Velocity = slope of the displacement-time graph: $v = \frac{dx}{dt} = \tan\theta$ $\frac{v_1}{v_2} = \frac{\tan 30^\circ}{\tan 45^\circ} = \frac{1/\sqrt{3}}{1} = \frac{1}{\sqrt{3}}$ So $v_1 : v_2 = 1 : \sqrt{3}$
2022 Phase 2 1 question
-
The position-time (x-t) graph for positive acceleration is:Positive acceleration means $\frac{dv}{dt}>0$, i.e. velocity (slope of the x-t graph) keeps increasing. So the x-t graph is a curve that bends upward (concave up).
2008 AIPMT 1 question
-
A particle shows distance-time curve as given in this figure. The maximum instantaneous velocity of the particle is around the point :
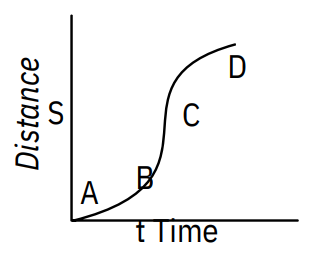 In a distance-time graph, the instantaneous speed at any instant is given by the slope of the curve at that instant: $v = \dfrac{ds}{dt}$.
So the instantaneous velocity is maximum where the curve is steepest.
Near A and B the curve is almost flat, so the slope (speed) is small.
Near D the curve flattens again, so the slope is small.
The curve rises most steeply around the point C, so the slope is maximum there.
Hence the maximum instantaneous velocity of the particle is around the point C.