Looking for classes? Ksquare Career Institute, Bengaluru →

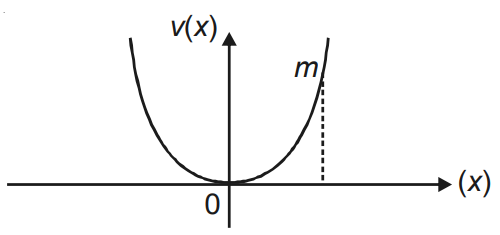
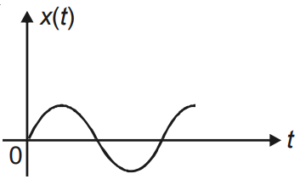
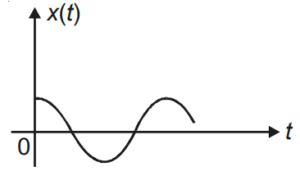
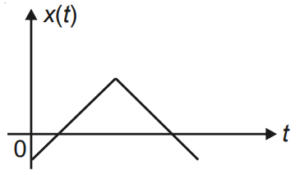
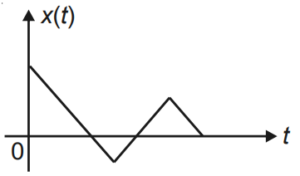
A particle of mass m is released from rest and follows a parabolic path as shown. Assuming that the displacement of the mass from the origin is small, which graph correctly depicts the position of the particle as a function of time?
A
- 
B
- 
C
- 
D
- 
Detailed Solution
The potential energy curve is a parabola, $V(x) \propto x^2$, so the restoring force is $F = -\frac{dV}{dx} \propto -x$.
A force proportional to displacement and directed towards the origin gives simple harmonic motion about the origin.
The particle is released from rest at a point away from the origin, so at t = 0 it is at an extreme position: x is maximum and the velocity (slope of the x–t graph) is zero.
Hence $x(t) = A\cos\omega t$.
The correct graph is the cosine curve that starts from maximum displacement at t = 0 and oscillates about x = 0.
A force proportional to displacement and directed towards the origin gives simple harmonic motion about the origin.
The particle is released from rest at a point away from the origin, so at t = 0 it is at an extreme position: x is maximum and the velocity (slope of the x–t graph) is zero.
Hence $x(t) = A\cos\omega t$.
The correct graph is the cosine curve that starts from maximum displacement at t = 0 and oscillates about x = 0.