Looking for classes? Ksquare Career Institute, Bengaluru →

The given graph is a representation of kinetics of a reaction.
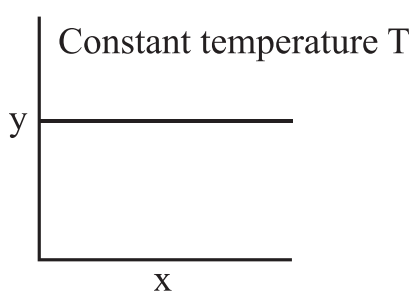 The y and x axes for zero and first order reactions, respectively are
The y and x axes for zero and first order reactions, respectively are
A
zero order (y = rate and x = concentration), first order (y = rate and x = $t_{1/2}$)
B
zero order (y = concentration and x = time), first order (y = $t_{1/2}$ and x = c concentration)
C
zero order (y = concentration and x = time), first order (y = rate constant and x = concentration)
D
zero order (y = rate and x = concentration), first order (y = $t_{1/2}$ and x = concenration)
Detailed Solution
The graph is a horizontal line (y independent of x).
Zero order: rate is constant and does not depend on concentration, so y = rate and x = concentration.
First order: $t_{1/2} = \frac{0.693}{k}$ does not depend on concentration, so y = $t_{1/2}$ and x = concentration.