Looking for classes? Ksquare Career Institute, Bengaluru →

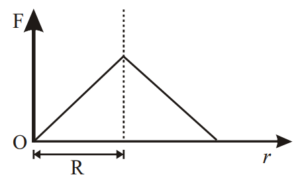
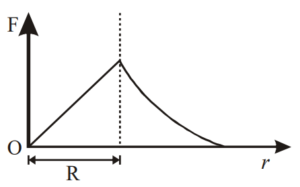
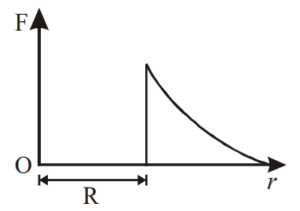
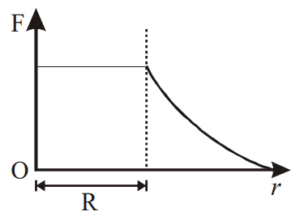
Which one of the following plots represents the variation of gravitational field on a particle with distance r due to a thin spherical shell of radius R? (r is measured from the centre of the spherical shell)
A
- 
B
- 
C
- 
D
- 
Detailed Solution
Inside a thin spherical shell (r < R) the gravitational field is zero.
At the surface it jumps to its maximum value $\frac{GM}{R^2}$.
Outside (r > R) it falls off as $\frac{GM}{r^2}$.
So the graph is zero up to r = R, rises abruptly at R and then decreases as $\frac{1}{r^2}$.
At the surface it jumps to its maximum value $\frac{GM}{R^2}$.
Outside (r > R) it falls off as $\frac{GM}{r^2}$.
So the graph is zero up to r = R, rises abruptly at R and then decreases as $\frac{1}{r^2}$.