Looking for classes? Ksquare Career Institute, Bengaluru →

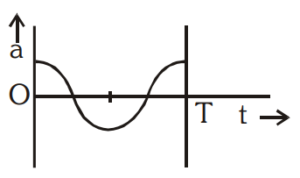
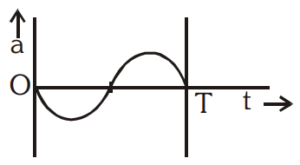
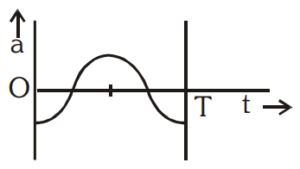
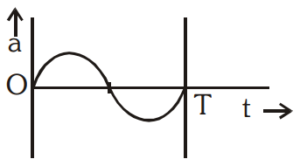
The oscillation of a body on a smooth horizontal surface is represented by the equation, $X = A\cos(\omega t)$ where X = displacement at time t, $\omega$ = frequency of oscillation. Which one of the following graphs shows correctly the variation of 'a' with 't'?
A
- 
B
- 
C
- 
D
- 
Detailed Solution
$x = A\cos\omega t$
$v = \frac{dx}{dt} = -A\omega\sin\omega t$
$a = \frac{dv}{dt} = -A\omega^2\cos\omega t$
So the a–t graph is a negative cosine curve: it starts at $-A\omega^2$ at t = 0.
$v = \frac{dx}{dt} = -A\omega\sin\omega t$
$a = \frac{dv}{dt} = -A\omega^2\cos\omega t$
So the a–t graph is a negative cosine curve: it starts at $-A\omega^2$ at t = 0.