Looking for classes? Ksquare Career Institute, Bengaluru →

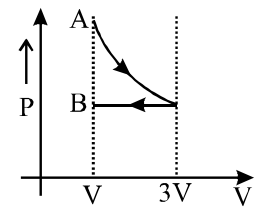
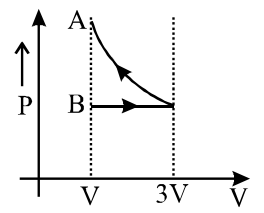
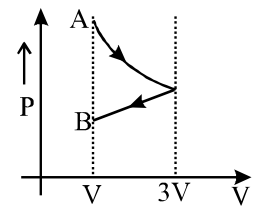
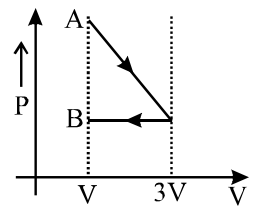
One mole of an ideal gas goes from an initial state A to final state B via two processes: It first undergoes isothermal expansion from volume V to 3V and then its volume is reduced from 3V to V at constant pressure. The correct P-V diagram representing the two processes is:
A
- 
B
- 
C
- 
D
- 
Detailed Solution
Isothermal expansion: PV = constant, so as the volume goes from V to 3V the pressure falls along a rectangular hyperbola.
Then the volume is reduced from 3V back to V at constant pressure: a horizontal straight line directed towards smaller volume.
So the diagram shows a falling hyperbola from A (at V) to 3V, followed by a horizontal line back to V ending at B, which lies below A.
Then the volume is reduced from 3V back to V at constant pressure: a horizontal straight line directed towards smaller volume.
So the diagram shows a falling hyperbola from A (at V) to 3V, followed by a horizontal line back to V ending at B, which lies below A.