Looking for classes? Ksquare Career Institute, Bengaluru →

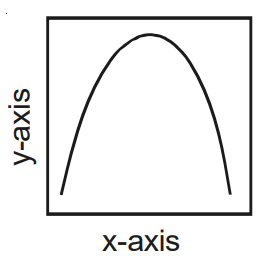
The curve given below shows enzymatic activity with relation to three conditions (pH, temperature and substrate concentration).
What do the two axes (x and y) represent?
What do the two axes (x and y) represent?
A
x-axis: Enzymatic activity; y-axis: Temperature
B
x-axis: Enzymatic activity; y-axis: pH
C
x-axis: Temperature; y-axis: Enzyme activity
D
x-axis: Substrate concentration; y-axis: Enzymatic activity
Detailed Solution
The curve is bell-shaped: the value on the y-axis rises to a peak and then falls.
In such graphs the dependent variable, enzyme activity, is plotted on the y-axis and the condition being varied on the x-axis.
Each enzyme shows its highest activity at a particular optimum temperature (and optimum pH); the activity declines both below and above the optimum, giving a bell-shaped curve.
At low temperature the enzyme is temporarily inactive, and at high temperature it is denatured.
With substrate concentration the curve is not bell-shaped: the velocity rises and then levels off at $V_{max}$.
Among the choices, the one consistent with the curve is x-axis: temperature and y-axis: enzyme activity.
In such graphs the dependent variable, enzyme activity, is plotted on the y-axis and the condition being varied on the x-axis.
Each enzyme shows its highest activity at a particular optimum temperature (and optimum pH); the activity declines both below and above the optimum, giving a bell-shaped curve.
At low temperature the enzyme is temporarily inactive, and at high temperature it is denatured.
With substrate concentration the curve is not bell-shaped: the velocity rises and then levels off at $V_{max}$.
Among the choices, the one consistent with the curve is x-axis: temperature and y-axis: enzyme activity.