Looking for classes? Ksquare Career Institute, Bengaluru →

Self-induction
Appears in
Concepts tested here
- Induced emf from i-t graph
- Voltage across an inductor
All Questions
2012 AIPMT-PRE 1 question
-
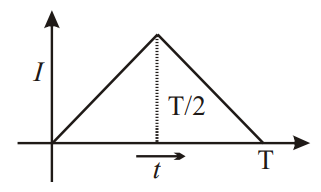
The current (I) in the inductance is varying with time according to the plot shown in figure. Which one of the following is the correct variation of voltage with time in the coil?
 Voltage across an inductor: $V = L\frac{dI}{dt}$ (the induced emf is $-L\frac{dI}{dt}$)
From 0 to $\frac{T}{2}$ the current rises linearly, so $\frac{dI}{dt}$ is a positive constant and V is constant and positive.
From $\frac{T}{2}$ to T the current falls linearly at the same rate, so V is constant and negative with the same magnitude.
So the V–t graph is a rectangular (square) wave: a positive step up to $\frac{T}{2}$, then an equal negative step up to T.
2011 AIPMT-PRE 1 question
-
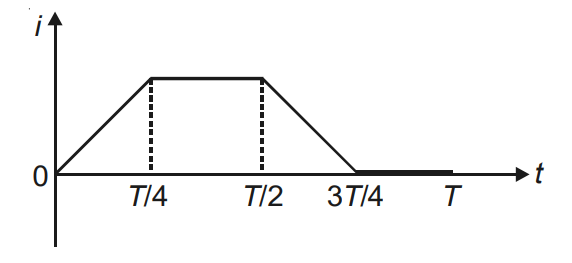
The current i in a coil varies with time as shown in the figure. The variation of induced emf with time would be
 Induced emf in the coil: $e = -L\frac{di}{dt}$, so the emf is proportional to the negative of the slope of the i–t graph.
From 0 to T/4 the current increases linearly (constant positive slope), so the emf is constant and negative.
From T/4 to T/2 the current is constant (zero slope), so the emf is zero.
From T/2 to 3T/4 the current decreases linearly (constant negative slope), so the emf is constant and positive.
From 3T/4 to T the current is again constant, so the emf is zero.
The correct graph is the one showing a constant negative emf from 0 to T/4, zero from T/4 to T/2, a constant positive emf from T/2 to 3T/4 and zero afterwards.