Looking for classes? Ksquare Career Institute, Bengaluru →

Thermodynamics
Thermodynamic Processes on a P-V Diagram
2 questions from 2 papers, each with its answer.
- questions
- 2
- papers
- 2
- years asked, 2017–2026
- 2 of 10
- of Thermodynamics
- 3.7%
All Questions
2022 1 question
-
An ideal gas undergoes four different processes from the same initial state as shown in the figure below. Those processes are adiabatic, isothermal isobaric and isochoric. The curve which represents the adiabatic process among 1, 2, 3 and 4 is :
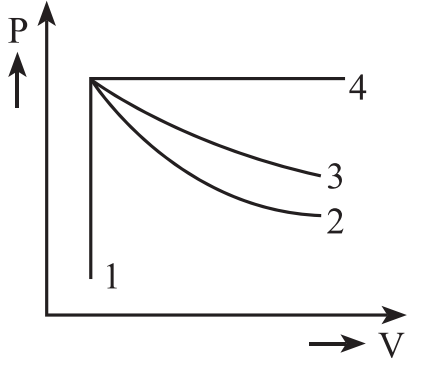 1: isochoric (vertical line, V constant)
2: adiabatic (steepest curve, $PV^\gamma$ = constant)
3: isothermal (less steep curve, PV = constant)
4: isobaric (horizontal line, P constant) So curve 2 represents the adiabatic process.
2017 1 question
-
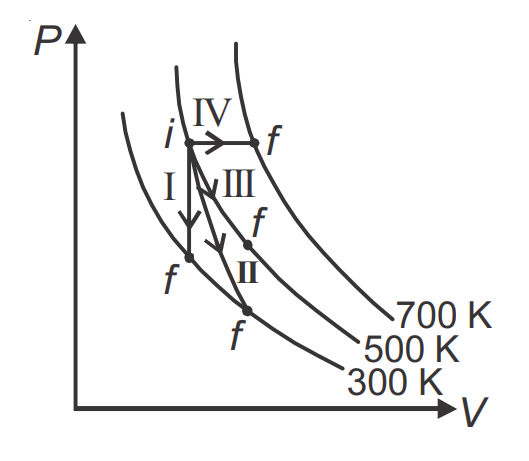
Thermodynamic processes are indicated in the following diagram. Match the following
Pick the matching item from Column II for each row.
Column I
- P. Process I
- Q. Process II
- R. Process III
- S. Process IV
Column II
- a. Adiabatic
- b. Isobaric
- c. Isochoric
- d. Isothermal
Correct answer: P → c, Q → a, R → d, S → b
Vertical line = isochoric, horizontal = isobaric, along isotherm = isothermal, steeper curve = adiabatic.
Process I = Isochoric Process II = Adiabatic Process III = Isothermal Process IV = Isobaric Correct match: P-c, Q-a, R-d, S-b.